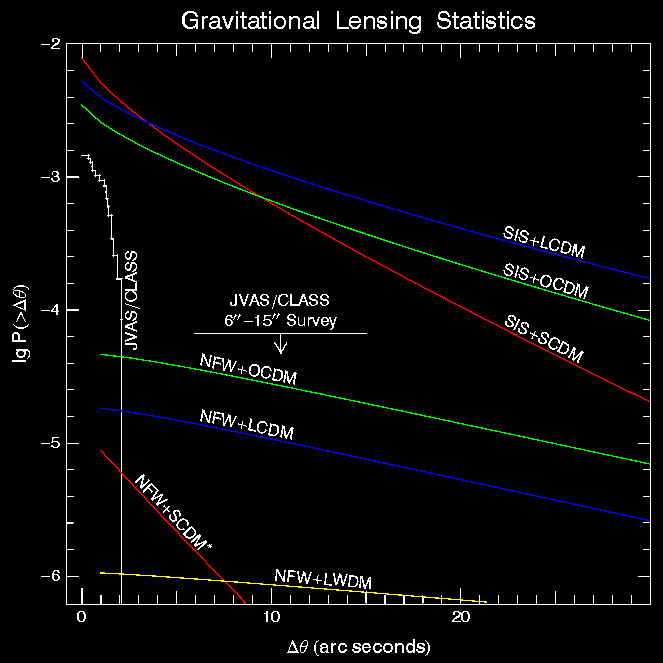

Gravitational lensing directly probes the mass distribution in the universe and thus can be used to constrain the cosmological parameters and test dark matter models. The figure shows the comparison of the theoretical predictions based on different models of dark matter and the universe with the combined observational results of the JVAS (Jodrell Bank-VLA Astrometric Survey) and CLASS (Cosmic Lens All-Sky Survey). The horizontal axis is the splitting angle between the two images formed by gravitational lensing of a background radio source, the vertical axis is the integrated lensing probability. The JVAS/CLASS results are shown with the histogram. The null result for lensing events with splitting angles between 6" and 15" is shown with the horizontal line with a downward arrow indicating that is an upper limit. The theoretical results are shown with color lines: red line for the standard cold dark matter (SCDM) model, blue line for the lambda cold dark matter (LCDM) model, green line for the open cold dark matter (OCDM) model, yellow line for the lambda warm dark matter (LWDM) model. The mass profile of the lens objects (e.g. galaxies) is alternatively taken to be the singular isothermal sphere (SIS) and the Navarro-Frenk-White (NFW) profile. The NFW+SCDM lensing probability has been multiplied by a factor 101.5 to fit it on the same scale as other models. Clearly, none of the existing models can completely explain the observed high ratio of small splitting to large splitting events. It is still unclear what causes this discrepancy between theories and observations, but it is most likely that there are at least two populations of lens objects in the universe: small mass objects with a steep inner density slope (e.g. galaxies), and large mass objects with a shallow inner density slope (e.g. clusters of galaxies). The figure also shows that the lensing probability is very sensitive to the mass profile of lenses. [For details see L.-X. Li and J. P. Ostriker, Astrophys. J. 566, 652 (2002).]
 Back to Li-Xin Li's Web Page